
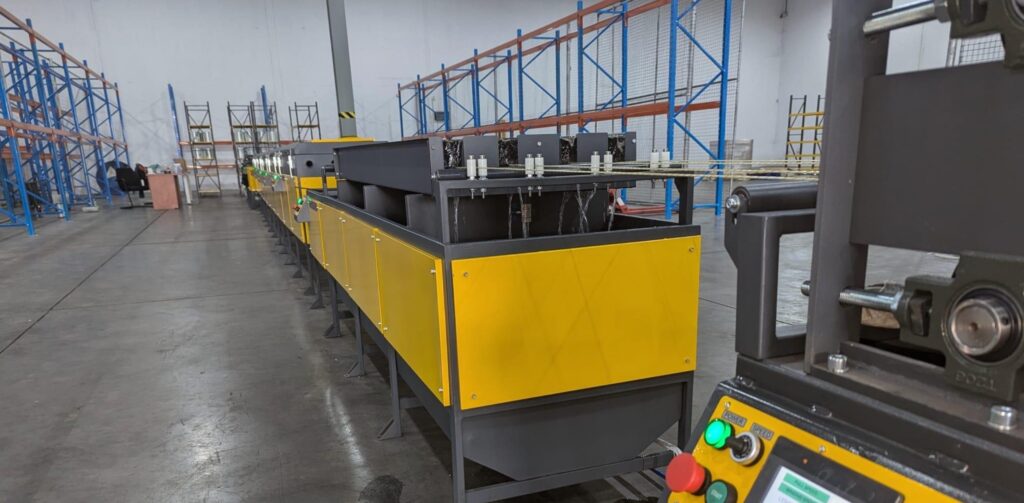
An industrial cost analysis based on Composite-Tech production equipment, raw material calculations and manufacturing economics.
There is a question almost every potential GFRP rebar manufacturer eventually asks.
Not whether fiberglass reinforcement can resist corrosion. Not whether it is lighter than steel. Not even whether construction companies are beginning to use it.
The question is more straightforward:
Can a factory manufacture GFRP rebar at a cost that leaves enough room for a profitable business?
The answer depends on the production process.
Two companies can purchase similar glass fiber and polymer resin, produce reinforcement of the same nominal diameter and sell to customers in the same market.
Yet their manufacturing costs can be substantially different.
One may operate a relatively slow line requiring considerable manual attention. Another may produce several reinforcing bars simultaneously using automated impregnation, polymerization, cooling and pulling systems.
Both are manufacturing GFRP rebar.
Their economics are not necessarily comparable.
For investors considering this business, understanding the difference between machine price, production capacity, manufacturing cost and actual profitability is essential.
This article examines those relationships using documented specifications for Composite-Tech’s CT6 New Generation production line and an illustrative financial model.
The objective is to explain where profit comes from, how manufacturing technology affects it and what an investor should calculate before purchasing equipment.
Quick Answer: Is GFRP Rebar Manufacturing Profitable?
GFRP rebar manufacturing can be a profitable industrial business when the factory combines competitive raw material purchasing, efficient production equipment, sufficient sales volume and consistent product quality.
The most important financial measure is not production cost per kilogram. It is the total cost per saleable meter or foot of reinforcement.
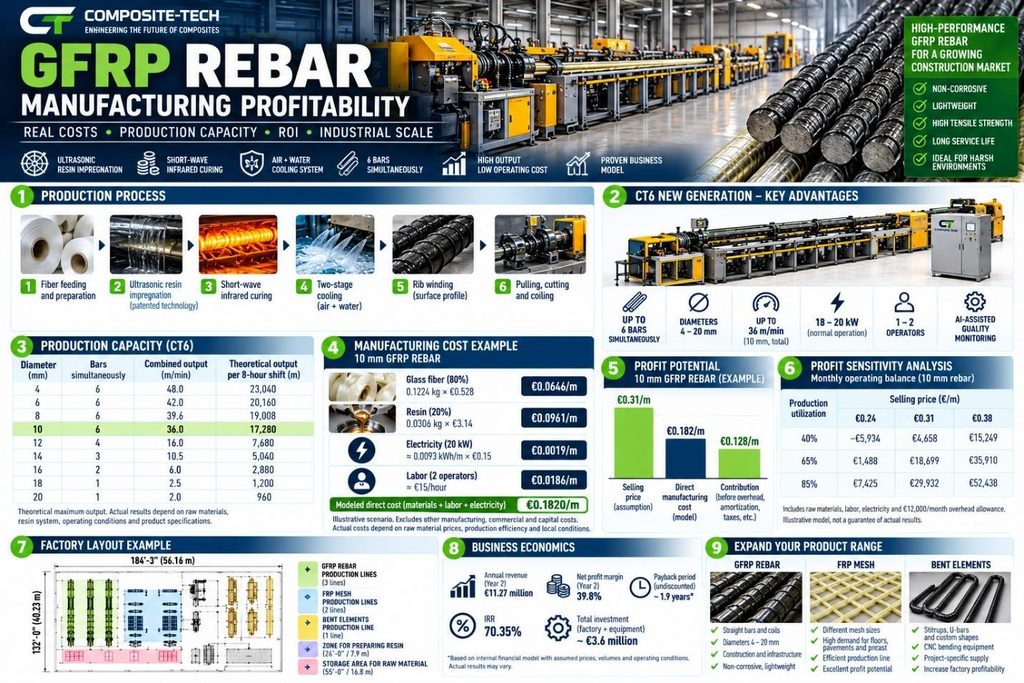
For example, Composite-Tech’s CT6 New Generation production line is designed to manufacture six 10 mm GFRP bars simultaneously at a combined output of up to 36 meters per minute.
Its documented normal operating power demand is approximately 18–20 kW after warm-up, and line control requires one or a maximum of two operators.
Using a defined financial scenario with glass fiber at €0.528/kg, resin at €3.14/kg, an 80/20 fiber-to-resin mass ratio and a finished bar weight of 0.153 kg/m, the principal raw materials for 10 mm reinforcement cost approximately €0.161 per meter.
Under an illustrative operating scenario with two operators, 75% effective production utilization and 0.5% rejected output, the modeled subtotal for materials, direct labor and production-line electricity is approximately €0.182 per saleable meter.
This is not the full factory cost or a guaranteed result.
It demonstrates why productivity, material efficiency, energy use and labor requirements have such a strong influence on the economics of GFRP rebar manufacturing.
Points clés à retenir
| Manufacturing Indicator | CT6 New Generation / Illustrative Scenario |
| Simultaneously produced 10 mm bars | Up to 6 |
| Combined 10 mm production rate | Up to 36 m/min |
| Theoretical 8-hour production | 17 280 m |
| Operators controlling the line | 1–2 |
| Operating electrical demand | Approximately 18–20 kW |
| Modeled raw material cost, 10 mm | €0.1607/m |
| Modeled direct-cost subtotal, 10 mm | Approximately €0.182/m |
| Illustrative selling price | €0.31/m |
| Key profit drivers | Sales volume, material prices, productivity, yield and operating costs |
Production figures are based on the CT6 New Generation manufacturer’s technical documentation. Financial figures are illustrative calculations, not actual factory financial results.
Understanding the Economics of GFRP Rebar Manufacturing
Before calculating profit, it helps to understand what the business actually produces.
GFRP rebar is manufactured from continuous glass fiber reinforcement and a polymer resin matrix.
The glass fibers carry most of the longitudinal tensile load. The polymer matrix holds the fibers together, transfers stress between them and protects the composite structure.
After impregnation, the material is formed into reinforcing bars with a defined geometry and external surface profile.
The bars are then cured, cooled and prepared for delivery.
The basic manufacturing process is continuous.
That matters economically.
A continuous industrial production line can manufacture substantial volumes without repeatedly stopping to create individual pieces.
However, not every production line offers the same throughput.
A factory’s financial performance depends on several variables.
| Variable | Effect on Manufacturing Economics |
| Prix de la fibre | Direct effect on raw material cost |
| Prix de la résine | Direct effect on raw material cost |
| Fiber/resin ratio | Influences material consumption and product properties |
| Number of simultaneously produced bars | Influences total production capacity |
| vitesse de traction | Influences output per hour |
| Resin impregnation efficiency | Influences material utilization and quality |
| Curing stability | Influences achievable production speed |
| Reject rate | Determines how much manufactured material becomes saleable |
| Operator requirements | Determines direct production labor costs |
| Electricity consumption | Influences operating expenses |
| Equipment reliability | Influences utilization and production interruptions |
The profitability of a manufacturing plant cannot be understood from any one variable.
But the relationship between these factors can be modeled.
Raw Materials: How Much Does It Cost to Produce GFRP Rebar?
Glass fiber and polymer resin are the two principal raw materials in conventional GFRP reinforcement.
Their relative proportions depend on the required product specification, fiber architecture and manufacturing process.
For this example, we use the following assumptions from a Composite-Tech manufacturing financial scenario.
Table 1. Raw Material Assumptions
| Paramètre | Valeur |
| Glass fiber price | €0.528/kg |
| Resin system price | €3.14/kg |
| Glass fiber share by mass | 80% |
| Resin share by mass | 20% |
| Assumed weight of 10 mm rebar | 0,153 kg/m |
These are model inputs, not verified current international market prices. The assumed material proportions must also be validated against the mechanical and durability requirements of the finished bar.
Calculating the Cost of 10 mm GFRP Rebar
For one meter of reinforcement weighing 0.153 kg:
Glass fiber consumption: 0.153 × 0.80 = 0.1224 kg
Resin consumption: 0.153 × 0.20 = 0.0306 kg
The cost of glass fiber is: 0.1224 × €0.528 = €0.0646
The resin cost is: 0.0306 × €3.14 = €0.0961
Therefore:
Total Principal Raw Material Cost = €0.1607/m
In imperial units, this is approximately €0.049 per linear foot.
The important observation is that the resin represents a considerable portion of the material cost, despite accounting for only 20% of the assumed product mass.
That makes resin impregnation efficiency particularly relevant.
A process that introduces unnecessary excess resin can increase manufacturing cost without providing a corresponding improvement in product performance.
Conversely, insufficient resin or incomplete fiber impregnation can produce internal defects and unacceptable reinforcement.
The economic objective is not simply to minimize resin consumption.
It is to achieve the correct, validated composite structure without unnecessary material waste.
GFRP Rebar Manufacturing Cost by Diameter
Different diameters require different amounts of raw materials.
A larger reinforcing bar contains more material per linear meter and usually requires different production speeds and process parameters.
Using the same raw material price assumptions, we can calculate the following illustrative costs.
Table 2. Principal Raw Material Cost per Meter
| Diamètre nominal | Assumed Weight | Glass Fiber + Resin Cost |
| 6 mm | 0.060 kg/m | €0.0630/m |
| 8 mm | 0.100 kg/m | €0.1050/m |
| 10 mm | 0,153 kg/m | €0.1607/m |
| 12 mm | 0.220 kg/m | €0.2311/m |
| 14 mm | 0.300 kg/m | €0.3151/m |
| 16 mm | 0.392 kg/m | €0.4118/m |
| 18 mm | 0.496 kg/m | €0.5210/m |
| 20 mm | 0.612 kg/m | €0.6428/m |
Source: Composite-Tech illustrative production cost model. Figures exclude production losses, secondary consumables and factory operating expenses.
These numbers highlight an important commercial characteristic of composite reinforcement.
The diameter influences both the amount of raw material consumed and the speed at which the product can be manufactured.
Consequently, the manufacturing cost per meter should be calculated separately for each product size.
A factory producing mostly 6 mm bars may have a very different output and cost structure from a factory producing predominantly 16 mm reinforcement.
This is why investors should avoid business plans based on a single generic production cost.
Why High Production Speed Changes the Business Model
The production equipment has a direct influence on the number of meters manufactured during each shift.
In GFRP rebar production, pulling speed is important, but it is not the complete picture.
The number of bars being manufactured simultaneously is equally important.
Consider a production line operating at a pulling speed of 6 meters per minute.
If the line produces one bar, the combined output is 6 meters per minute.
If it produces six bars simultaneously, the combined output is 36 meters per minute.
This is the operating principle behind Composite-Tech’s CT6 New Generation.
Table 3. CT6 New Generation Production Capacity
| Diamètre | Nombre de barres | Combined Output, up to | Theoretical 8-Hour Output |
| 4 mm | 6 | 48 m/min | 23 040 m |
| 6 mm | 6 | 42 m/min | 20 160 m |
| 8 mm | 6 | 39,6 m/min | 19 008 m |
| 10 mm | 6 | 36 m/min | 17 280 m |
| 12 mm | 4 | 16 m/min | 7 680 m |
| 14 mm | 3 | 10,5 m/min | 5 040 m |
| 16 mm | 2 | 6 m/min | 2 880 m |
| 18 mm | 1 | 2,5 m/min | 1 200 m |
| 20 mm | 1 | 2 m/min | 960 m |
Source: Composite-Tech CT6 New Generation Installation and Operation Manual, July 2026.
These are indicative maximum capacities. Actual throughput depends on resin chemistry, curing conditions, raw materials and equipment operation.
The commercial significance is considerable.
At the documented maximum output, one CT6 line can manufacture 17,280 meters of 10 mm reinforcement during an uninterrupted eight-hour shift.
A slower production line may require more operating hours, additional equipment or additional shifts to manufacture the same volume.
The impact extends beyond productivity.
It also affects the cost of labor, electricity and factory overhead allocated to every meter.
For this reason, high production capacity can become a significant competitive advantage.
What Makes CT6 New Generation Different?
Production speed is only valuable when the line can maintain acceptable product quality.
Increasing pulling speed reduces the time available for impregnation, forming, polymerization and cooling.
If the process cannot accommodate that change, defects may increase.
This is one reason why production-line development requires more than installing a faster pulling motor.
Composite-Tech has developed a combination of specialized technologies intended to support high-throughput FRP reinforcement manufacturing.
Three systems are particularly important.
Patented Ultrasonic Resin Impregnation
One challenge in composite reinforcement production is ensuring that resin penetrates the continuous fiber bundle.
Glass fiber roving contains numerous individual filaments.
During impregnation, polymer binder must reach the internal regions of the bundle while minimizing trapped air and dry areas.
Composite-Tech uses an impregnation system incorporating ultrasonic treatment and pneumatic squeezing.
The ultrasonic system is intended to improve resin penetration and assist in removing trapped air.
The pneumatic squeezing system helps control excess resin.
This combination addresses two different requirements:
Complete impregnation and controlled material consumption.
Both affect business economics.
Poor impregnation can produce rejected material. Excess resin can increase the cost of every manufactured meter.
The technology is designed to improve control over this stage of the process.
However, any claimed improvement in final bar strength, void content or resin consumption should be established through controlled, product-specific testing.
Short-Wave Infrared Polymerization
After impregnation and surface formation, the resin must cure.
Polymerization requires a suitable combination of resin chemistry, temperature and time.
If curing is incomplete, the finished composite may not achieve its required matrix properties.
If heating is excessive or poorly controlled, product quality may also suffer.
Composite-Tech incorporates a short-wave infrared booster before the main curing ovens.
This system is designed to accelerate the initial heating and polymerization process before the reinforcement passes through the conventional thermal curing stages.
The objective is to support stable curing at industrial production speeds.
In practice, the curing schedule must still be validated for each combination of resin, diameter and pulling speed.
Two-Stage Air-and-Water Cooling
After curing, the reinforcement exits the heated section of the production line.
Cooling is necessary before final pulling, cutting or coiling operations.
Composite-Tech uses a two-stage system:
First air cooling, then water cooling.
This arrangement is intended to reduce the initial temperature of the composite more gradually before it enters the water-cooling stage.
The purpose is to manage thermal gradients and reduce the risk of cooling-related surface defects.
Together, ultrasonic impregnation, infrared heating and controlled cooling form an important part of Composite-Tech’s high-output production concept.
Their economic purpose is straightforward:
Support greater throughput while maintaining the process conditions required for consistent reinforcement quality.
Labor Costs: Why Automation Matters
Labor is an important consideration when establishing an industrial facility.
But the relevant measurement is not simply the number of employees.
It is the amount of finished product that can be manufactured per paid operating hour.
The CT6 New Generation manual specifies that the line can be controlled by one or a maximum of two operators.
To understand the financial effect, consider a simple example.
Assume:
- Two operators;
- €15 per hour per operator;
- An eight-hour shift;
- 17,280 meters of theoretical maximum production.
The direct operator cost is:
2 × €15 × 8 = €240 per shift.
At maximum uninterrupted output, this corresponds to approximately €0.0139 per meter.
Actual labor cost per saleable meter will be higher when the equipment operates below its theoretical capacity.
For example, at 75% effective productive utilization and 0.5% rejected output, the same labor cost is distributed across approximately 12,895 saleable meters per shift.
The resulting direct labor cost becomes approximately:
€0.0186 per saleable meter
This calculation illustrates the relationship between automation and output.
A manufacturer can improve labor productivity by increasing the number of saleable meters produced during each paid shift.
It does not mean that an entire factory needs only two employees. Material handling, maintenance, quality control, logistics and administration may require additional personnel.
Electricity: Calculating Cost per Meter
Electricity is another component of manufacturing cost.
The CT6 New Generation manual reports a normal operating electrical demand of approximately 18–20 kW after the equipment reaches operating temperature.
At a combined production rate of 36 m/min for 10 mm rebar: 36 × 60 = 2,160 m/hour.
Using 20 kW as the power demand: 20 ÷ 2,160 = 0.00926 kWh/m.
At an assumed electricity tariff of €0.15/kWh: 0.00926 × €0.15 = €0.00139/m.
This figure is based on continuous operation at the stated production rate.
At lower effective utilization, electricity cost per saleable meter may increase.
The financial examples below conservatively allocate the assumed operating electrical demand across all scheduled shift hours.
Table 4. Illustrative Energy Economics
| Paramètre | Valeur |
| Operating power assumption | 20 kW |
| Electricity tariff assumption | €0.15/kWh |
| Maximum 10 mm output | 2 160 m/heure |
| Electricity cost at maximum output | €0.00139/m |
| Electricity cost per 1,000 m | Approximately €1.39 |
The electricity required by external systems, warm-up, compressors, ventilation and other factory equipment must be evaluated separately.
Nevertheless, these calculations explain why high output and efficient production can make direct line electricity a relatively small component of unit manufacturing cost.
A Realistic Manufacturing Scenario: One CT6 Production Line
We can now combine material costs, labor, electricity and production utilization.
To avoid presenting maximum theoretical output as actual factory production, we will use a more conservative operating scenario.
Table 5. Production Model Assumptions
| Paramètre | Assumption |
| Equipment | CT6 New Generation |
| Produit | 10 mm GFRP rebar |
| Maximum combined output | 2 160 m/heure |
| Shift duration | 8 hours |
| Working days per month | 22 |
| Effective production utilization | 75% |
| Rejected output | 0.5% |
| Opérateurs | 2 |
| Labor cost per operator | €15/hour |
| Line electricity demand | 20 kW |
| Electricity price | €0.15/kWh |
| Raw material cost before losses | €0.1607/m |
This is an illustrative business model, not a record of actual customer production.
How Much Can the Factory Manufacture?
Maximum theoretical monthly output: 2,160 × 8 × 22 = 380,160 m.
At 75% effective utilization: 380,160 × 0.75 = 285,120 m.
After a 0.5% rejection allowance: 285,120 × 0.995 = 283,694 m.
Therefore:
Modeled Monthly Saleable Production: Approximately 283,700 Meters
This equals approximately 930,700 linear feet.
The distinction between theoretical and saleable production is important.
Factories earn revenue from products they can sell, not from nominal machine capacity.
Manufacturing Cost per Saleable Meter
Using the assumptions above, we can calculate the direct manufacturing cost.
The raw material cost is adjusted for rejected output.
Labor is calculated for two operators working 22 eight-hour shifts.
Electricity is conservatively calculated for all scheduled production hours.
Table 6. Illustrative Direct Manufacturing Cost — 10 mm GFRP Rebar
| Cost Component | Cost per Saleable Meter |
| Glass fiber and resin, adjusted for rejects | €0.1615 |
| Direct operator labor | €0.0186 |
| Production-line electricity | €0.0019 |
| Modeled Direct-Cost Subtotal | €0.1820/m |
This is equivalent to approximately €0.0555 per linear foot.
The calculation excludes other expenses, including certain consumables, maintenance, packaging, quality testing, facility overhead, financing, taxes and depreciation.
These additional costs vary considerably by factory location and business model.
Still, the result illustrates an important point.
In this scenario, matières premières account for most of the calculated direct production cost.
Labor and electricity contribute much smaller amounts.
That is one reason why efficient material processing is essential to factory profitability.
How Much Revenue Can a GFRP Rebar Factory Generate?
Revenue depends on the selling price and the quantity customers actually purchase.
For our illustrative scenario, assume the factory sells 10 mm GFRP rebar at: €0.31 per Meter
This figure is taken as a business-planning assumption. It is not presented as a verified current market price.
At monthly sales of 283,694 meters: 283,694 × €0.31 = approximately €87,945.
Table 7. Monthly Manufacturing Economics
| Financial Indicator | Monthly Value |
| Saleable output | 283,694 m |
| Assumed selling price | €0.31/m |
| Sales revenue | €87,945 |
| Principal raw materials, adjusted for rejects | €45,822 |
| Direct operator labor | €5,280 |
| Production-line electricity | €528 |
| Balance after these direct costs | €36,315 |
This balance is not net profit.
It is the amount remaining after the listed direct costs, before other factory and commercial expenses.
For example, a factory may also pay rent, maintenance, testing, packaging, distribution, administration, insurance and financing costs.
The important question is how much of the remaining balance is required to cover those expenses.
What Happens After Factory Overhead?
To make the example more useful, assume an additional monthly allowance of:
€12,000 for Factory and Business Overhead
This is a simplified assumption for the scenario.
It is not a verified estimate for a particular plant or country.
Under these conditions:
| Financial Indicator | Monthly Value |
| Revenue | €87,945 |
| Principal raw materials | €45,822 |
| Direct labor | €5,280 |
| Line electricity | €528 |
| Additional overhead allowance | €12,000 |
| Modeled Operating Balance | €24,315 |
This result is before any expenses not captured by the model, depreciation, financing costs and taxes.
The operating balance is approximately 27.6% of the assumed revenue.
It should not be described as a guaranteed net profit margin.
Nevertheless, it demonstrates why investors are interested in efficient composite reinforcement manufacturing.
At sufficient production utilization and selling prices, a highly automated production line can create substantial operating contribution.
The Most Important Question: What Happens If Sales Are Lower?
A good manufacturing business plan should not be based only on favorable conditions.
Selling price and capacity utilization are two of the most important variables.
A factory may have equipment capable of producing 380,000 meters per month, but it will not necessarily sell that amount immediately.
Market development takes time.
Therefore, a serious investment analysis should consider multiple scenarios.
For the following sensitivity analysis, we use the same 10 mm production model, including a 0.5% rejection rate, the same raw material prices, scheduled operator labor, electricity and the €12,000 monthly overhead allowance.
Only selling price and effective production utilization change.
Table 8. Monthly Operating Balance Sensitivity
| Effective Production Utilization | Selling Price €0.24/m | Selling Price €0.31/m | Selling Price €0.38/m |
| 40% | −€5,934 | €4,658 | €15,249 |
| 65% | €1,488 | €18,699 | €35,910 |
| 85% | €7,425 | €29,932 | €52,438 |
Illustrative calculations based on the stated operating assumptions. The values are modeled operating balances, not net income or cash flow.
This table is particularly useful because it shows the relationship between sales, price and manufacturing efficiency.
At lower utilization, fixed expenses are distributed across fewer meters.
At higher utilization, the same equipment and factory infrastructure can support greater sales volume.
A relatively small change in selling price can also have a substantial effect on the operating result.
These relationships matter more than an isolated claim about exceptionally high profit margins.
What Is the Break-Even Point for a GFRP Rebar Factory?
The break-even point is the production and sales level at which revenue covers the costs included in the model.
For the illustrative scenario, the raw material cost per saleable meter is approximately €0.1615.
The assumed selling price is €0.31.
This leaves approximately €0.1485 per meter before scheduled labor, electricity and the overhead allowance.
Under the stated cost assumptions, the model reaches operating break-even at approximately: 120,000 Saleable Meters per Month
This is equivalent to an effective production utilization of approximately: 31.7%
That calculation applies only to the cost categories included in the example.
A complete project break-even analysis must account for additional operating expenses, financing arrangements and product-specific costs.
However, the example demonstrates the importance of choosing production equipment with a competitive cost structure.
The more efficiently a factory converts materials into saleable products, the more flexibility it may have when market prices or sales volumes change.
How Production Technology Influences Profit Margins
Equipment affects profitability through several mechanisms.
The first is production output.
The second is material consumption.
The third is product consistency.
The fourth is labor and energy efficiency.
The fifth is production availability.
Composite-Tech developed CT6 New Generation around the interaction of these factors.
Table 9. Manufacturing Technology and Financial Impact
| Composite-Tech Technology | Manufacturing Objective | Potential Financial Benefit |
| Multi-bar production | Produce several bars simultaneously | More output per production hour |
| Imprégnation ultrasonique | Improve resin penetration | Better process consistency |
| Pneumatic resin squeezing | Control excess binder | Reduced unnecessary resin consumption |
| Bobinage de nervures contrôlé par ordinateur | Maintain surface geometry | More repeatable product |
| Short-wave infrared booster | Support initial polymerization | Potentially higher stable production speed |
| Controlled curing ovens | Maintain required cure conditions | More consistent product quality |
| Refroidissement par air et eau en deux étapes | Manage cooling gradients | Lower risk of cooling-related defects |
| Automated pulling | Maintain continuous movement | Production stable |
| Automatic cutting and coiling | Reduce manual handling | Improved finishing efficiency |
| AI-assisted optical monitoring | Detect visible process deviations | Earlier operator intervention |
The actual financial benefit of each technology depends on operating conditions and should be confirmed through production records and comparative testing.
The important point is that these technologies are not included merely to make the machine more sophisticated.
They address process variables that influence the relationship between production speed, material use and finished-product quality.
For an industrial manufacturer, that relationship determines manufacturing competitiveness.
Why the Cheapest Production Line Is Not Necessarily the Most Profitable
Equipment purchasing decisions are frequently influenced by initial price.
But a machine that costs less to purchase may cost more to operate.
Consider the difference between two production systems.
One produces fewer bars per hour and requires substantial manual supervision.
The other produces more bars simultaneously using automated process control.
Even if the second system requires a higher initial investment, it may offer a lower cost per saleable meter.
The correct comparison must include:
| Comparison Factor | Why Investors Should Measure It |
| Equipment acquisition cost | Initial capital requirement |
| Production output by diameter | Real manufacturing capacity |
| Operators per line | Direct labor requirement |
| Power consumption per meter | Efficacité énergétique |
| Resin consumption | Raw material efficiency |
| Rejected product percentage | Material and capacity losses |
| Maintenance requirements | Production availability |
| Product changeover time | Scheduling efficiency |
| Product qualification | Ability to supply target markets |
| Technical support | Commissioning and operational risk |
A lower purchase price is attractive only if it does not create greater operating costs or limit the factory’s commercial potential.
That is why equipment evaluation should always include a manufacturing cost calculation.
How Do You Calculate Return on Investment?
Return on investment is often presented as a simple payback claim.
In reality, a manufacturing investment should be evaluated using several financial measures.
These include total initial investment, operating profitability, working capital, financing, taxes and actual cash generation.
A useful starting point is the simple payback calculation.
Simple Payback Period = Initial Investment ÷ Annual Net Cash Inflow
However, the difficulty is determining realistic annual net cash inflow.
The operating balance calculated earlier is not the same as free cash flow.
Additional expenditures, taxes, capital maintenance, inventory requirements and customer payment terms must be considered.
Example: Why Payback Scenarios Matter
Suppose an investor is evaluating a manufacturing project requiring an illustrative total investment of €350,000.
Depending on the project’s actual net cash generation, the simple payback could differ significantly.
| Annual Net Cash Inflow | Illustrative Simple Payback |
| €60,000 | 5.8 years |
| €100,000 | 3.5 years |
| €150,000 | 2.3 years |
| €200,000 | 1.8 years |
The €350,000 investment is a hypothetical planning figure, not a quotation for a CT6 New Generation factory.
These scenarios illustrate the mathematics of payback. They are not forecasts of actual Composite-Tech customer returns.
A professional financial model should also calculate Net Present Value (NPV) and Internal Rate of Return (IRR).
These methods help investors understand whether the expected future cash flows justify the capital committed to the project.
Why Adding FRP Mesh Can Improve the Business Model
A factory that manufactures only straight GFRP rebar serves one category of reinforcement demand.
A factory that also manufactures FRP mesh can serve additional applications.
Mesh is commonly purchased by area rather than linear length.
This makes it particularly relevant to industrial floors, slabs, precast products, pavements and other applications where reinforcement is distributed across large surfaces.
Composite-Tech manufactures dedicated FRP mesh production equipment alongside its rebar lines.
From an investment perspective, this creates an opportunity to diversify the factory’s product portfolio.
The internal financial model prepared for Composite-Tech also illustrates why the mesh category deserves attention.
Table 10. Illustrative FRP Mesh Material Economics
| Mesh Configuration | Modeled Raw Material Cost | Assumed Selling Price |
| Ø6 mm, 100 × 100 mm | €1.260/m² | €3.59/m² |
| Ø6 mm, 150 × 150 mm | €0.882/m² | €2.51/m² |
| Ø8 mm, 100 × 100 mm | €2.101/m² | €4.66/m² |
| Ø8 mm, 150 × 150 mm | €1.471/m² | €3.26/m² |
Source: Composite-Tech internal financial planning scenario. Prices and material costs are assumptions, not independently verified market quotations.
These calculations show the modeled difference between principal raw material cost and selling price.
The difference is not net profit.
Mesh production also requires labor, electricity, production equipment, factory space, quality control and distribution.
Nevertheless, the scenario illustrates the potential commercial value of manufacturing complementary reinforcement products.
A customer may purchase straight GFRP rebar for one project and FRP mesh for another.
A producer capable of supplying both has more opportunities to serve the same construction market.
The Next Step: Rebar, Mesh and Bent Composite Elements
An integrated FRP reinforcement factory can go further.
Construction projects frequently require more than straight reinforcing bars.
They may also require bent elements, stirrups, U-shaped bars and reinforcement manufactured to specific dimensions.
These products require dedicated manufacturing technologies.
Composite-Tech offers equipment for straight reinforcement, FRP mesh and factory-made bent composite elements.
This creates the possibility of building a broader industrial business.
| Produit | Commercial Opportunity |
| Barres d'armature droites en PRFV | General reinforcement supply |
| Coiled reinforcement | Distribution of suitable smaller diameters |
| Maille FRP | Area-based reinforcement supply |
| Bent composite elements | Project-specific shapes |
| Cut-to-length bars | Contractor-ready materials |
| Complete reinforcement packages | Multiple products for one project |
The financial advantage is not simply that the factory can manufacture more products.
It is that the business can approach more types of customers.
A distributor, precast manufacturer, infrastructure contractor and industrial flooring company may have different purchasing requirements.
A broader product portfolio gives the manufacturer more ways to serve those requirements.
Quality Control Is Part of Profitability
Manufacturing cost cannot be separated from quality.
A factory producing inexpensive reinforcement that repeatedly fails testing may not have a sustainable business.
For products intended for structural concrete applications, material properties must be verified.
In the United States, ASTM D7957/D7957M-26 establishes requirements for GFRP reinforcing bars, including mechanical and physical properties, qualification testing and production-lot quality control.
Important properties include tensile capacity, modulus, ultimate tensile strain, fiber content, degree of cure and bond behavior.
This matters economically because serious customers purchase more than a nominal diameter.
They purchase reinforcement that must perform according to engineering requirements.
A manufacturer that consistently supplies documented, traceable products can compete on technical reliability rather than price alone.
This is another reason why production technology and quality monitoring deserve attention during the investment process.
The most profitable factory is not necessarily the one that produces the cheapest-looking bar. It is the one that can manufacture acceptable, documented reinforcement at a competitive and repeatable cost.
What Investors Should Understand Before Starting a GFRP Rebar Business
The financial attractiveness of GFRP rebar manufacturing is connected to several industrial characteristics.
Raw material costs can be modeled by diameter.
Production capacity can be measured in meters per minute.
Electricity consumption can be calculated per meter.
Labor requirements can be measured against saleable output.
And the business can expand into complementary product categories.
These characteristics make the industry relatively suitable for structured financial analysis.
But investors must also understand the commercial side.
A machine capable of producing 300,000 meters per month does not automatically create demand for 300,000 meters.
Sales channels, product qualification, technical support and customer relationships remain essential.
The most successful manufacturing strategy is therefore likely to combine three elements:
Efficient production technology.
Consistent, technically documented products.
A realistic commercial strategy for selling the output.
When these elements work together, GFRP reinforcement manufacturing can become an attractive industrial investment.
Planning a Profitable GFRP Rebar Manufacturing Business?
Before investing in composite reinforcement production equipment, it is worth understanding what your factory can actually produce and how much each meter will cost.
Composite-Tech develops industrial equipment for manufacturing GFRP and BFRP rebar, Maille FRP and bent composite reinforcement.
Our engineering team can help prospective manufacturers evaluate equipment configuration, production capacity, factory layout and the technical requirements of their proposed business.
Request a preliminary production cost assessment and equipment proposal for your project.
Discover more:
- Professional FRP Rebar Production Lines – Composite-Tech manufacturing equipment for fiberglass and basalt reinforcement.
- CT6 New Generation – High-output, multi-bar GFRP manufacturing technology.
- FRP Mesh Production Equipment – Expand your factory into area-based composite reinforcement products.
- Documentation technique de Composite-Tech – Equipment information and technical resources for planning production.
Conclusion: Profitability Begins with Production Efficiency
The profitability of GFRP rebar manufacturing is not determined by the price of glass fiber alone.
It depends on how effectively a factory converts raw materials into reinforcement that customers are willing to buy.
Production speed, simultaneous bar output, resin impregnation, curing, cooling, electricity consumption, labor requirements and quality control all influence that result.
Composite-Tech’s CT6 New Generation combines multi-bar production with specialized ultrasonic impregnation, infrared-assisted curing and controlled air-and-water cooling.
These technologies are intended to support high-output manufacturing while maintaining the process conditions required for consistent product quality.
For investors, the business opportunity extends beyond straight Barres d'armature en PRFV.
FRP mesh and factory-made bent reinforcement offer additional product categories, allowing a manufacturer to address a broader range of construction applications.
The essential question is not simply how much a production line costs.
It is how much reliable, saleable reinforcement that production line can manufacture — and whether the resulting business can compete profitably in its target market.
Efficient manufacturing creates the opportunity. Product quality and customer demand turn that opportunity into a business.
FAQ: GFRP Rebar Manufacturing Costs, Profitability and ROI
Is GFRP rebar manufacturing profitable?
GFRP rebar manufacturing can be profitable when sales prices and volumes are sufficient to cover raw materials, labor, electricity, factory overhead and capital costs. Manufacturing efficiency and product quality have a substantial influence on profitability.
How much does it cost to produce one meter of GFRP rebar?
The cost depends on diameter, material prices, manufacturing process and operating conditions. In a defined Composite-Tech financial scenario, principal raw materials for 10 mm rebar cost approximately €0.161/m. A separate illustrative operating calculation produces a direct-cost subtotal of approximately €0.182 per saleable meter.
How many meters can a CT6 rebar production line produce?
Composite-Tech’s CT6 New Generation is designed for combined output of up to 36 m/min when producing six 10 mm bars simultaneously. This corresponds to a theoretical maximum of 17,280 meters during an uninterrupted eight-hour shift.
How many operators are required for CT6 New Generation?
According to the manufacturer’s technical documentation, the production line can be controlled by one or a maximum of two operators. A complete factory may require additional staff for raw materials, maintenance, quality control and logistics.
Why is high production capacity important for profitability?
Greater output allows certain labor, electricity and factory costs to be distributed across more saleable meters. However, production capacity improves profitability only when the factory can maintain quality and sell the resulting output.
Does ultrasonic impregnation reduce GFRP manufacturing costs?
Ultrasonic impregnation is intended to improve resin penetration into the fiber bundle. When combined with effective resin content control, it may support material efficiency and process consistency. Actual savings depend on the formulation, equipment settings and validated production results.
Why does Composite-Tech use short-wave infrared heating?
The short-wave infrared booster is designed to support the initial stages of resin heating and polymerization before the material enters the main curing ovens. This helps the production system manage curing conditions at industrial line speeds.
Why does Composite-Tech use air-and-water cooling?
The two-stage cooling system is intended to control the temperature transition after curing. Air cooling reduces the initial thermal load before the reinforcement enters the water-cooling stage.
What is the break-even point of a GFRP rebar factory?
There is no universal break-even point. It depends on selling price, production volume, material costs, staffing, overhead and financing. In the illustrative one-line scenario presented here, operating break-even occurs at approximately 120,000 saleable meters per month under the stated assumptions.
How long does it take to recover an investment in GFRP production equipment?
The payback period depends on total initial investment and net cash generation. Investors should calculate payback, NPV and IRR using realistic sales assumptions, working capital requirements, taxes and financing costs.
Is FRP mesh manufacturing profitable?
FRP mesh manufacturing can be profitable when the manufacturer has competitive material costs, suitable equipment, reliable customers and sufficient output. Production economics should be calculated per square meter or square foot.
Should a new factory manufacture both GFRP rebar and FRP mesh?
An integrated product strategy can be attractive because rebar and mesh serve different purchasing requirements. However, equipment investment should match demonstrated local demand and available capital.